
Where people stop
6 min read
By Eduardo Orellana ·
7,229 people reached the site between 5 August and 04:32 UTC on 27 September 2026. 1,031 of them clicked download. That is 14.26 percent. The other 6,198 looked, and left, before a file existed.
Most people stop before the download
6,198 of 7,229 is 85.74 percent. They opened a page. The page recorded them as a person, not a crawler and not one of our own browsers. They did not click download. That is the largest drop in the funnel, and it is a choice. Nothing on the failure list below is “the page would not load” at that scale. The page was there. They left.
Of the 1,031 who clicked, 650 got the installer. 63.05 percent of the click, 8.99 percent of the visit. 269 of the 1,031 clicked and no transfer started. 158 cancelled a download that never added up to a file. Those two counts are not a clean split of the 381 who clicked and did not get the file, because a person can show up in more than one of the page’s columns. What the columns do say: most of the click-to-file drop is a transfer that never started, or one the person cancelled, not a file that arrived broken.
The installer is usually closed, not crashed
398 people started the Windows installer. 368 of those visits include a finish. 148 include a cancel. 9 include a failure. Finish plus cancel is more than 398, so these are not three slices of one group. A person can start, cancel, and also finish on another try. Read them as the page records them: a cancel is common, a failure is not. Nine failures against 148 cancels is the installer telling on itself. Closing the wizard is the person. The failure is ours, and it is small next to the cancel.
Getting a file and opening the app are not the same people, and they are not even the same kind of count. The file is a browser. The install, from here on, is a machine’s first app open. 457 machines opened the app. The one place the two sides join exactly is a Windows download key that later opens the app: 180 did. Of the Edge downloads, 144 of 418 opened, 34.45 percent. Of the Chrome downloads, 34 of 180 opened, 18.89 percent. 144 and 34 are 178. The page’s join is 180, so two opens were another Windows browser. Do not read 650 files and 457 opens as “193 people downloaded and did not install”. The units changed.
The app opens more often than Play is pressed
204 of 457 machines pressed Play. 44.64 percent. 253 did not, 55.36 percent. On Windows that is 234 of 429. On macOS it is 19 of 28. Two Windows machines had the app open the game by itself and never pressed Play. They are in the 253. The timing, and the fact that many Play presses happen before any AI answer, is in how long a first game takes.
260 of 457 installs signed in, 56.89 percent. 246 recorded a send attempt, 53.83 percent. 180 got a finished answer, 39.39 percent. The gap from attempt to answer is 66 machines. That gap is not one cause. Some of the attempts are a send at the sign-in gate that never became a message. The failures that the product actually caught are the next section, and they are not 66 neat rows.
What those 180 answers were asked to build is a different set again: 223 accounts with a stored first message, not 457 machines. That list is what first-time creators asked.
Day two keeps about one Windows install in ten
Day 2 is not “opened the app on a calendar tomorrow”. It is the retention query’s window: anything a person caused, in the 24 hours starting 24 hours after that machine’s own first open. The machine counts only if those 48 hours had already closed by the read. 36 of 380 did it. 9.47 percent. Windows is 35 of 354, 9.89 percent. macOS is 1 of 26, 3.85 percent. 77 installs were too new to be in the 380.
The stricter reading, that they used the product on that day rather than only opening it, is 24 of 354 on Windows, 6.78 percent, and the same one Mac. 344 of the 380 were not back in the window. That is 90.53 percent. It is a person not coming back. It is not, by itself, a crash. Some of them had already hit a failure on day one. The failures are below, and they do not cover 344 machines.
The three reasons we recorded most are ours
The caught-errors list, every row, not the 200 most recent, groups like this. The three reason lines with the most rows:
The AI was unavailable. 193 rows, 58 machines. The turn was asked and the AI was not there. That is our fault.
The request was no longer authorized. 193 rows, 20 machines. The signed-in session had died, and the same machines kept finding out. That is our fault. Twenty machines produced as many rows as the fifty-eight, which is a retry, not twenty times the damage.
The turn was refused because the project had no identity the AI could work on. 93 rows, 10 machines. We would not take the request. That is our fault.
The wider family, any failed AI turn, is 560 rows on 115 machines. The three lines above are the ones the list records most. They are categories of a failure, not a person and not a machine name. A usage limit, a busy project, and an installer copy error are further down the list. The installer failure in the counts is 9 people. It does not make this top three.
So the split is plain. The recorded breakage is ours: the AI missing, the session dying, the project refused. The leaving is theirs: 6,198 people who never clicked, the cancels on the installer, the 253 machines that never pressed Play, the 344 that were not back on day 2. Both are in the same product. Pretending the funnel is a bug, or pretending the failure list is a matter of taste, would be the same lie in opposite directions.
How the funnel was counted
Landing, the download click, the file, and the installer are the counts query last-day-counts, from 1 August 2026 through 04:32 UTC on 27 September. The events themselves start on 5 August, so the earlier bound adds nothing. A landing is a person on a page, with crawlers, our own browsers, and preview hosts removed, the way that query removes them. A file is a person who got a whole installer. An install, from the app open onward, is a machine’s first open, with the same machine filters as the retention query: test, internal, unreleased, and our own accounts out. 457 is that count, and it matches the Windows-plus-macOS installs in the timing post.
Play is a press, not the app opening the game. Day 2 is the retention query last-day-retention, the 24-hour window starting at 24 hours, and only machines whose window had closed. The three reasons are the caught-errors query, every matching row since the table began, grouped by the reason line. The panel on the counts page shows 200 of those rows, newest first. The ranking here is the full group, rows and machines both, so one machine retrying is visible as rows rather than as people.
The drop is the honest description of an AI game maker, which is what that term is, and of why the tools in the category are not substitutes, which is how they split.
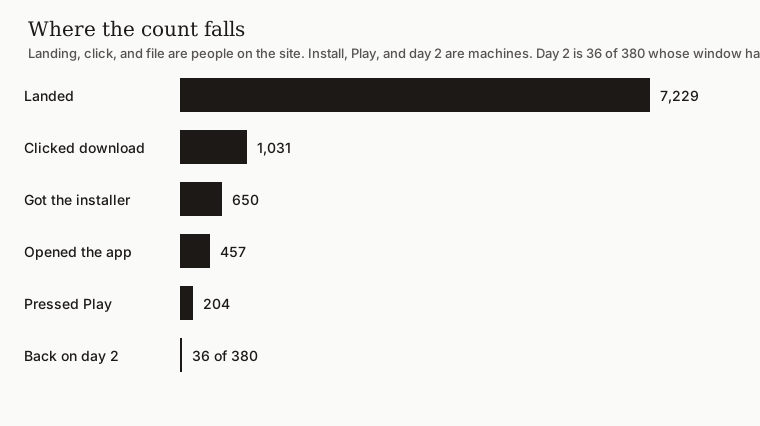
From the landing page to the next day
Counted 27 September 2026. The first three rows are people on the site. From the app open on, the count is machines. Day 2 uses only machines whose 48 hours had closed. A row is not always a subset of the row above.
| Step | Count | Of the step before |
|---|---|---|
| Landed | 7,229 people | — |
| Clicked download | 1,031 people | 14.26% of people who landed |
| Got the installer | 650 people | 63.05% of people who clicked |
| Opened the app | 457 machines | A different count, not a subset of 650 |
| Pressed Play | 204 machines | 44.64% of machines |
| Back on day 2 | 36 of 380 machines | 9.47% of machines whose window had closed |